Thorough preparations
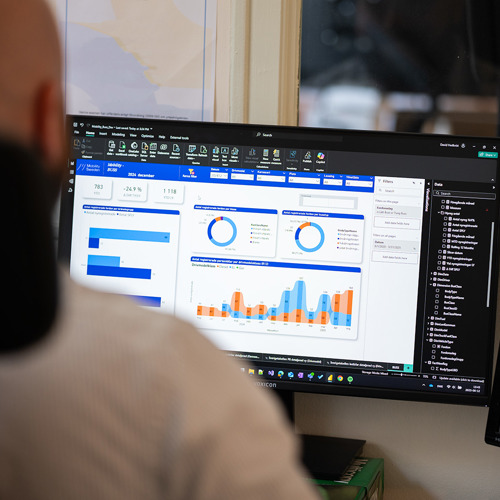
To create as smooth a rollout as possible, Bilvision began extensive proactive work long before the finished statistics platform was delivered to Mobility Sweden. A kind of test version of the platform was set up with sample reports without real data, which made it possible to invite users among the member companies at an early stage.
- We then gradually added more reports, more functions in the APIs and more test users. In this way we could both show what was on the way and gather important feedback from members along the way, says Ludvig Åstrand, project manager at Bilvision.
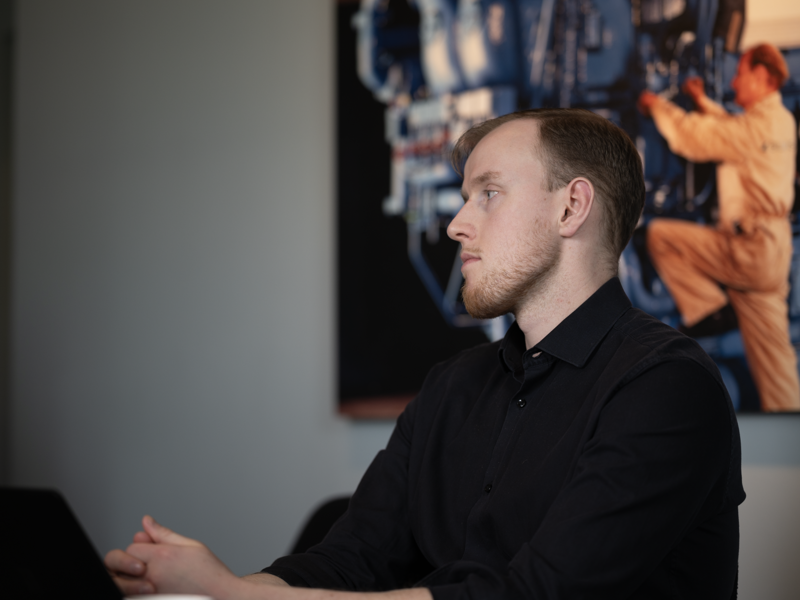
Ludvig Åstrand, project manager at Bilvision
Webinars as a channel for dialogue An important part of the preparations was also holding training webinars for the member companies, both to show how the system works and to help users get started.
- The first webinars covered basic functions and how the Power BI reports are built up. Later sessions could focus more on new features that were on the way, which created familiarity. By the time we went live, many were already familiar with the interface - and that made the transition a fairly painless process, says Ludvig.
The training webinars also became a valuable forum for dialogue, and gave members the chance to provide their input. That goes hand-in-hand with Bilvision's project methodology of letting the customer give feedback on features during development.

The challenge: Finding flexible solutions for many users
One of the biggest challenges in the project was finding common solutions that worked for many users, without missing meeting individual needs. Previously many reports had been customised at the individual level. Now hundreds of users would consume the same reports, without the possibility of personal training or bespoke customisation.
-
We talked with many different players at Mobility Sweden with different products and interests. Then it was about finding common denominators in which features we can offer to create value for as many as possible. One example is how we've worked with filtering options - in the platform it's easy to add further data points while each user can make personal settings in their reports, says Ludvig, and continues:
-
Usually it's not about layout wishes like changing the colour or shape of a button, but more about being able to follow up on financing form or break down new-registration statistics by a specific segment. Being able to filter out the noise and focus on what's relevant is a crucial feature for all members.
A platform that can grow with the needs
Mobility Sweden didn't just need a new statistics platform; they also needed someone who would still be there after delivery. That's why Bilvision's work now continues with developing features and reports as new needs arise.
- It means we've really had to listen to the members to understand what they need here and now, but also try to identify upcoming needs. Customer feedback, support cases and other requests are very much what drives the development of new features, Ludvig explains.
Understanding the customer's needs, even the unspoken ones, is an important lesson the team takes away from the project.
- Here we've worked closely with the customer, both visually and technically, and iterated our way forward. Bilvision always works with personal relationships, but what's been different here is that we've had to talk with many different users to find a common solution. Our strength is that we don't complicate things - we try to break down the needs and make it simple. We also know that what the customer asks for isn't always what they actually need - the needs will change and then you have to think ahead and try to be one step ahead, Ludvig concludes.

Want to read about how it all started?
In part one we describe more about who Mobility Sweden are and the background to Bilvision's assignment: to build a new statistics platform for the country's vehicle stock and mobility.